As of December 18, 2023, this resource at Version 3-1 running from Amazon S3. It now includes the entire contiguous United States rendered from 1 meter data where available. Please grab a new link from the download icon below. Don't forget to flush cache in Google Earth if you have been running the older version of the Survey recently. Should any large "X" occur in your field of view, it is likely because of a change made to the survey on our end. Please run through the CACHE FLUSH sequence and load again. Another occasional issue is having the ground data from Google Earth appear "above" the bare earth elevation map. This is likely because the viewer has been set to present Google "3D" data, which is buildings and trees. Not all areas have 3D data, so the experience will vary from place to place. Just turn off "3D Buildings" in the layers panel.
Amazon has recently alerted me that some users of the Survey are running older Google Earth clients that do not support the 1.2 or 1.3 Transport Level Security protocols. Google Earth has been supporting the higher levels for the past 3 years, so there is good reason in that alone to grab a new copy of Google Earth for your system. Its free, and getting it now will allow you to avoid having your requests against the Survey's S3 bucket denied - although Amazon has not yet stated the drop-dead-date.
This version of my work is being distribute as "LiDAR-HRTM", effective with this V3.1 release. That release includes seamless coverage across the 48 contiguous United States. The underlying datasets were created to support a research project, the Ovoid Basin Atlas of the USA.
The survey project and all my scientific endeavors are entirely privately funded.
Cintos is the author's nom de plume. I have utilized Cintos as a handle, username and domain name for my internet presence since the 1990's.
Michael Davias 203-705-9272
Send me an email
MY ORCID ID:
 https://orcid.org/0000-0002-8960-4075
Access to the High resolution Topology Models (HRTMs) is provided for non-commercial use, providing either "Cintos" or "Michael Davias" are credited in the re-distribution in any manner. The imagery and control KMZ are served from an Amazon S3 cloud bucket, for which I am charged for storage and bandwidth. Should you find these resources to be of value, I'd appreciate a small donation to help me defray the costs.

This work is licensed under a Creative Commons Attribution 4.0 International License.
Geological Research by Cintos is licensed under a Creative Commons Attribution-NonCommercial-ShareAlike 3.0 Unported License.
Based on a work at Cintos.org.
Permissions beyond the scope of this license may be available at http://cintos.org/about.html.
Visualization Tool Using Google Earth
Discussed here is the third visualization of the survey. The first version, started in 2011, leveraged the Google Fusion Table geospatial survey facility to feed individual bay features into Google Earth from a cloud-based repository based on queries driven by Google Earth. As of 12/2019, Google has shuttered the Fusion Table facility, and those queries no longer function. The V2 version replaced those visualizations with "regionalized" network links accessing raster HRTM imagery held on an Amazon S3 cloud. This third version removes much of the clutter of 1º and 15' quadrilateral outlines. A faint 15' quadrilateral remains to support a "right click" to focus the DOM on that particular 15' quad's kml structure for editing purposes. At V3.1, the survey offers 1 m resolution HRTMs across the entire contiguous United States. Approximately 75% is at a resolution of ~1m, while the remainder is at 3m or 10m. The survey is updated quickly when the USGS or other agency provides additional bare earth LiDAR elevation datasets. The coverage of the "basin & range" and Northern Rocky Mountains currently has the thinnest LiDAR coverage. Very few US States have 100% LiDAR coverage, so you will likely encounter areas with 10 meter or 3 meter data. The difference is quite perceivable!
The images below illustrate how the KMZ maintains efficiency by leveraging the regionalization technology. As the user zooms in closer to the earth, increasingly higher resolution data is presented. Most 1m resolution HRTMs offer five levels of resolution. Depending on computer power and network bandwidth, the higher resolution level may take some time to load. While zooming in.
By refreshing the Google Earth loader file using the link below, the latest version available can be accessed. When renewing your copy, it may be best to flush the cache on your Google Earth instance to prompt access to new version of these files. As of March 2023, the survey has identified, measured and mapped over 70,000 basins.
The current HRTM maps use a 10-meter cyclic perceptive color ramp, which provides a relative elevation reading for the local terrain, as each color re-appears every 10 meters. Just as importantly, the rendering adds "hill shade" to produce a 3D effect through shadows. Considering we are focusing here on subtle landscape features, that hill shade is exaggerated 20x compared to normal sun shadow. In effect, a 5 meter hill will cast a shadow as if it was 100 meters tall. The downside is that terrain details of steep slopes on a high mountain's shadow side get lost in the shade.
A single-cycle color-to-elevation is provided as a screen overlay, providing a relative index for the elevation values. Each color is provided as a "modulo 10 m" value, allowing a quick assessment of the fine elevation details when viewing flat terrain. The Google Earth elevation value is typically within a meter or two of the USGS-provided value, which should be referenced to advise the actual elevation above sea level.
Metrics: as of October 2023, the survey's High Resolution Topographical Models (HRTMs) encompasses seamless coverage for 940 USGS 1º quadrangles across the entire contiguous United States. Within each of those quadrangles, most have sixteen 15 minute quadrangles (15'), yielding a net of 14,000 quadrants (some 15' USGS scopes include Atlantic and Gulf coastal waters with no LiDAR). ~75% of the active 15 minute quadrangles contain LiDAR resolution data, rendered at 1 meter horizontal grid resolution, each requiring ~160 raster tiles for Google Earth presentation. 3-meter and 10-meter data is used for the remainder, and they require far lower number of tiles. The total jpeg tile count is currently ~1,200,000 which occupy ~ 1.3 Terabytes of data storage in an Amazon S3 cloud bucket.
The new Survey's visualization using the KMZ approach may well overload a mobile device or a smaller desktop computer, although I have taken pains to design it to avoid that.
I'd appreciate any feedback you may be willing to share using the comment function below. On an iOS device, Google Earth App will run a long time without crashing, but it will if a lot of movement is attempted.
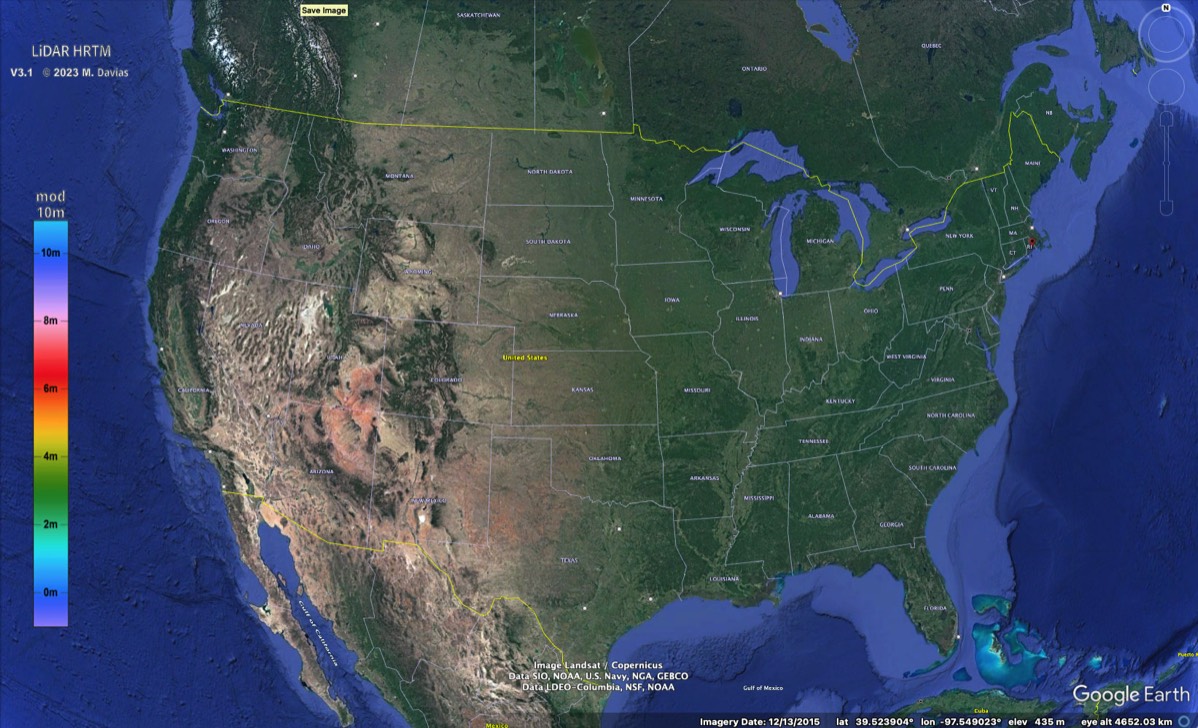
The next images will walk you through use of the above link's kmz in Google Earth. The first iPad shows the basic layout of the user's viewport. The elements of the atlas displayed here are the logo in the upper left and the modulo 10 meter elevation -to- color legend. Regardless of where the viewer will be browsing across the continental USA, this legend will relate the relative elevation for the colors seen in the topographic model. Dark blue starts at sea level (0 meters), and cycles back to blue at every elevation modulo 10 meters. The protocol was chosen specifically to hi-light delicate terrain features on virtually level terrain wherever such a situation exits. In areas of higher relief, the color bands provide a seamless set of contour lines across the viewport.
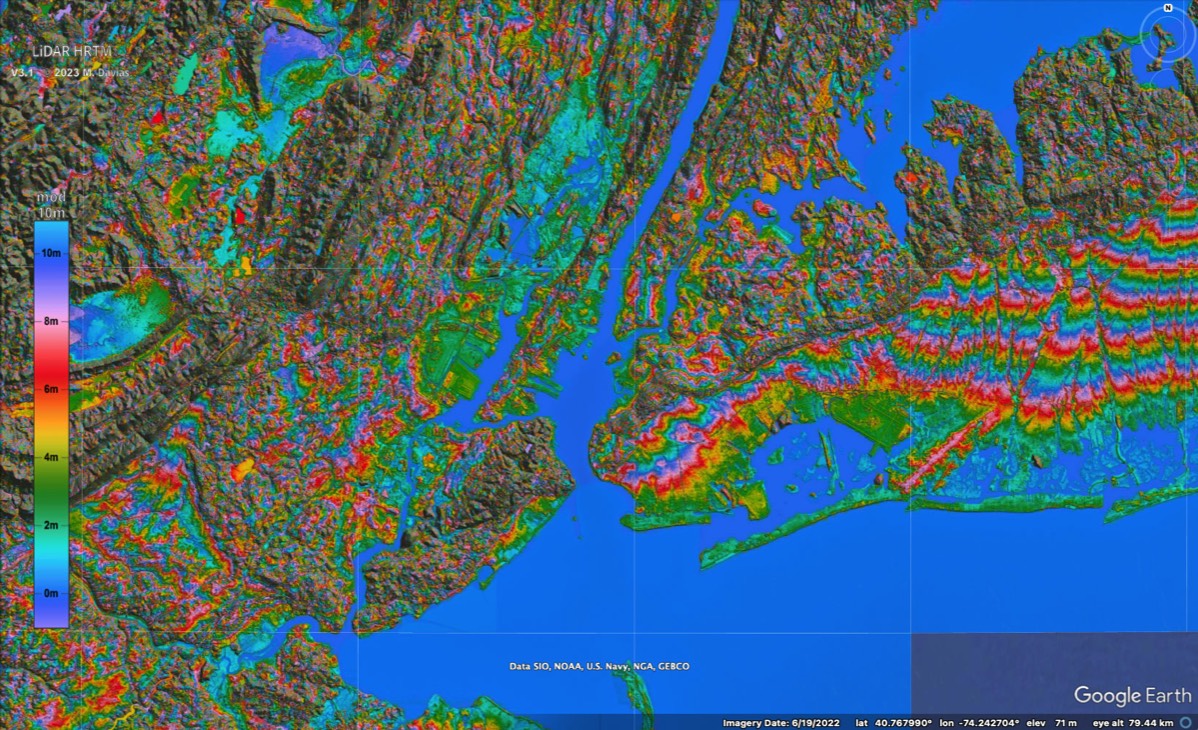
When the users viewport zoomes to eye view altitudes below 100 km, the display of the HRTMs begins. These are regionalized, so will become higher resolution as the viewer zooms further in. This version of my LiDAR elevation model utilizes a color ramp enhanced for human perception and cycles every 10 meters. Thus, the ocean (@ 0 meters) is solid dark blue and the uplands of the New York Region take on a shading based the relief. Areas with gentle terrain show broad areas of color, and generates the fathering seen in the gentle slope of Long Island on the left, as it flows down from the elevated glacial moraine in the North, to the Atlantic shore to the South.
As the user zooms into New York Harbor, the HRTM KMZ enables higher resolution tiles to be activated.
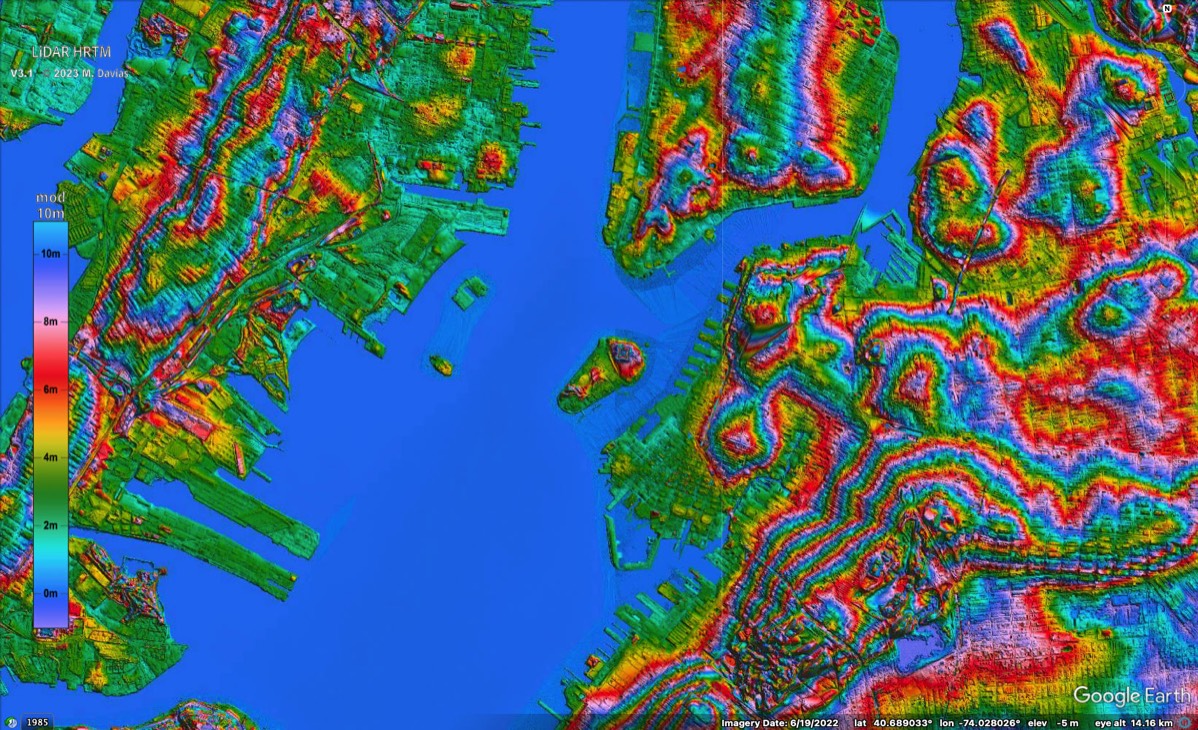
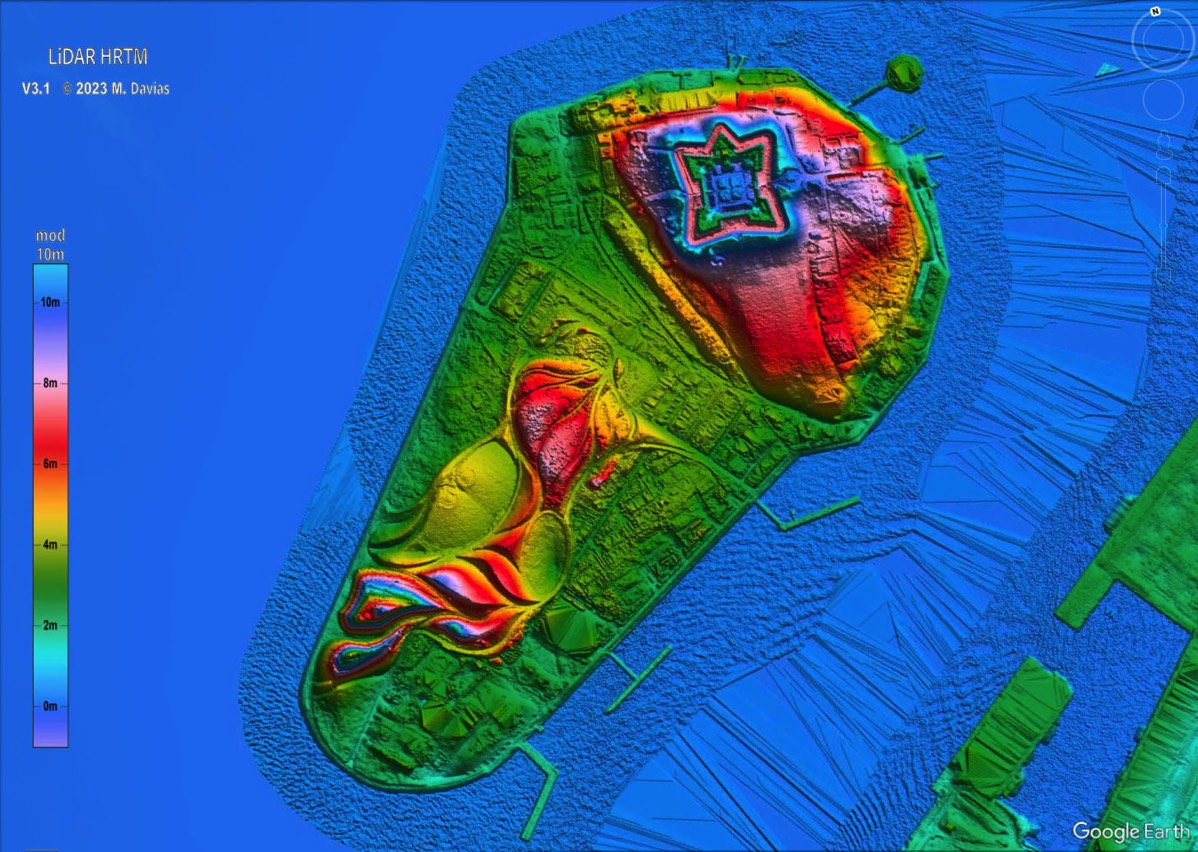
Closer still, we see the islands that host the Stature of Liberty, Ellis Island with the National Museum of Immigration and Govenor's Island at the foot of Manhattan, again pulling in even higher resolution imagery.
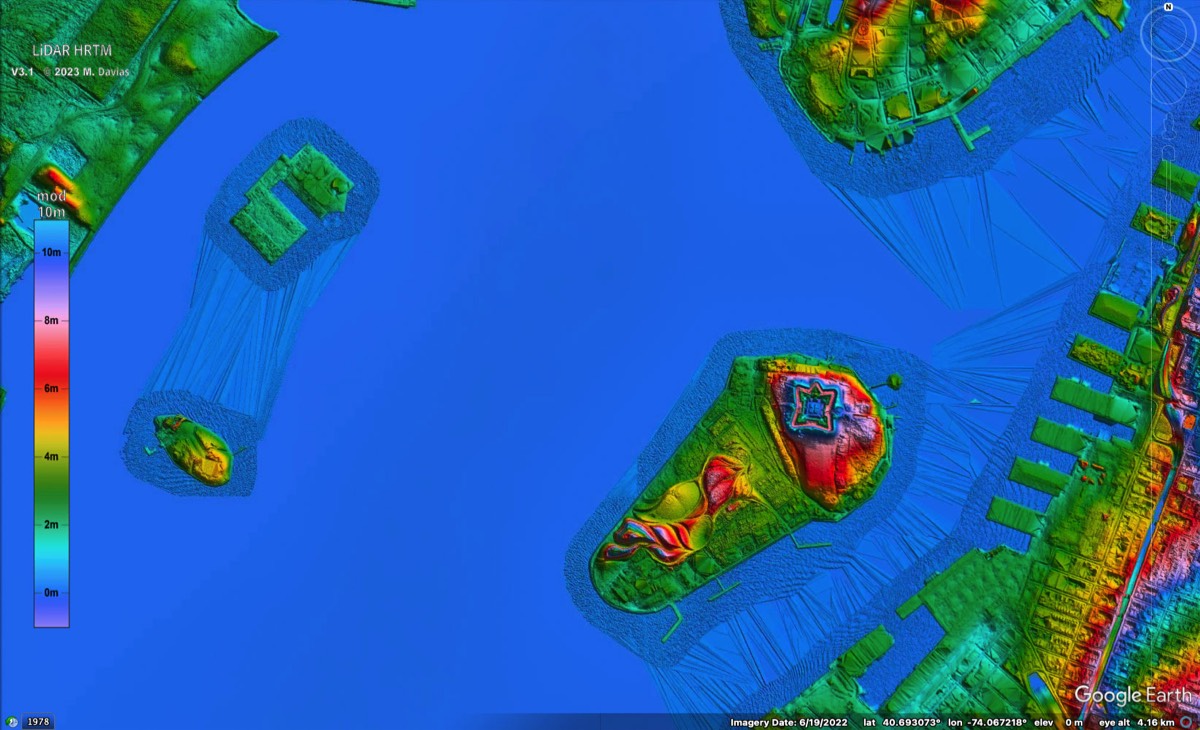
In closer and the 1m resolution LiDAR HRTM tiles offer a nice view of Fort Jay, on Governor's Island. Here the elevation-to-color legend properly defines the harbor is at sea level (0 meters), the outer walls of the fort at 10 meters (blue), and the inner bastions at 13 meters (green). Such a one-to-one only occurs close to the coast, as the colors will cycle again going from 10 to 20 meters; 20 to 30 meters and upward.
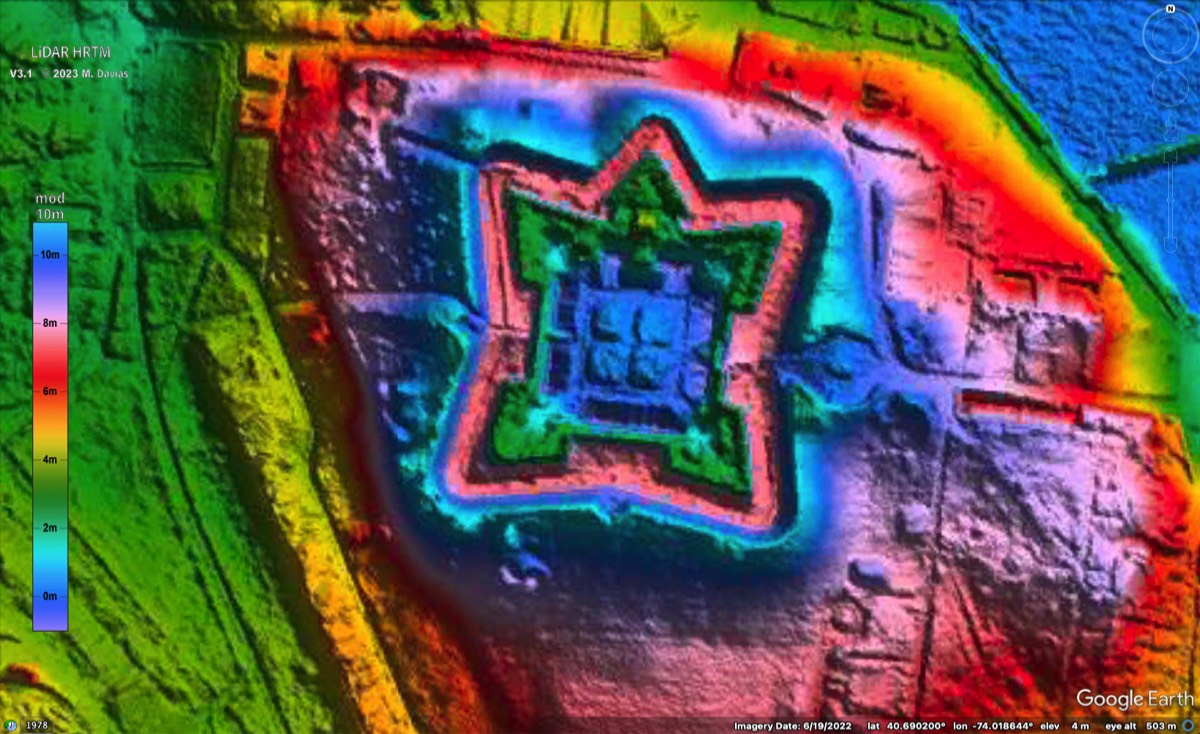
The detailed image of Fort Jay, above, remains quite crisp even when back ing out to see the entire island.
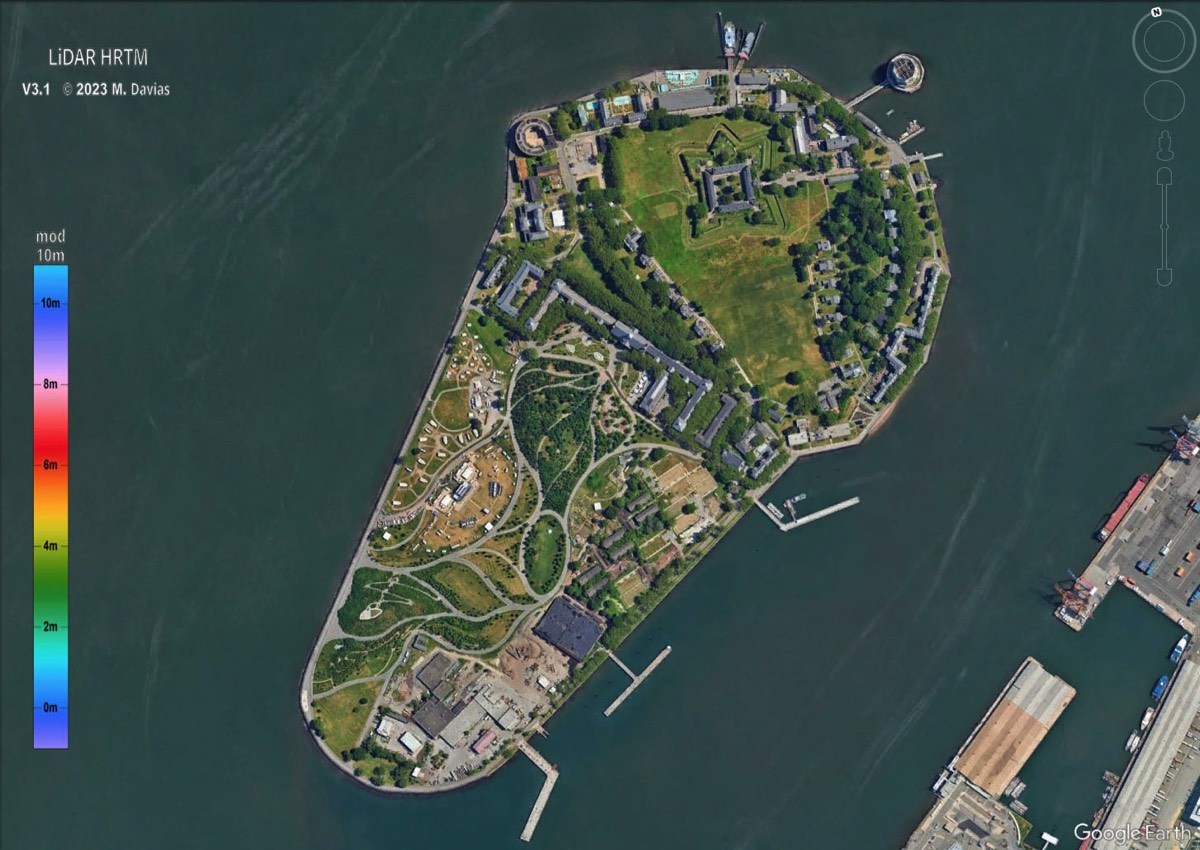
Of course, at any time you can toggle "off" the raster imagery and reveal the Google Earth satellite view.

This work is licensed under a Creative Commons Attribution 4.0 International License.
Geological Research by Cintos is licensed under a Creative Commons Attribution-NonCommercial-ShareAlike 3.0 Unported License.
Based on a work at Cintos.org.
Permissions beyond the scope of this license may be available at http://cintos.org/about.html.